Volatility
- 정의. Liability to change rapidly and unpredictably, especially for the worse
>> In our context, how much price/value tends to change from one period to the next
- Risk에 대해 이해하고 관리할 필요 있음
- 이 riskiness를 어떻게 양적화하고 비교할 수 있을지?
Calculating annualized historical volatility
- Vol_annualized = Vol_daily * root (252)
# Calculating the standard deviation of daily returns
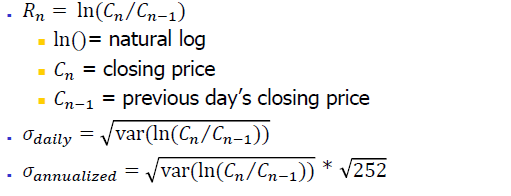
+ 252 = 365일 중 trading days (거래일)

- pandas.Dataframe.shift()
Annualized historical volatility
- Volatility는 기간에 따라 다르게 계산됨
- 따라서 Day traders는 10 - to 20-day volatility를, Long term investors는 1- to 10-year volatility를 살펴봐야함
Ways to hedge against volatility
-Using derivatives
(파생상품 ; 환율이나 금리, 주가 등의 시세변동에 따른 손실 위험을 줄이기 위해 일정 시점에 일정한 가격으로 주식과 채권 같은 전통적인 금융삼품을 기초자산(underlying assets) 으로 하여 새로운 현금흐름을 가져다주는 증권 / eg. 선물, 옵션 등)
- Diversification
+ hedge : 영어 단어 뜻은 (금전 손실을 막기 위한) 대비책. 환율, 금리 또는 다른 자산에 대한 투자 등을 보유하고 있는 위험자산의 가격변동을 제거하는 과정을 의미하기도 한다.
---
Distribution of returns
- 어떻게하면 Financial instrument의 잠재적인 리스크 (potential risk)를 파악할 수 있을까?
- Volatility나 가격의 standard deviation (표준편차)은 정확하고 또 충분한가?
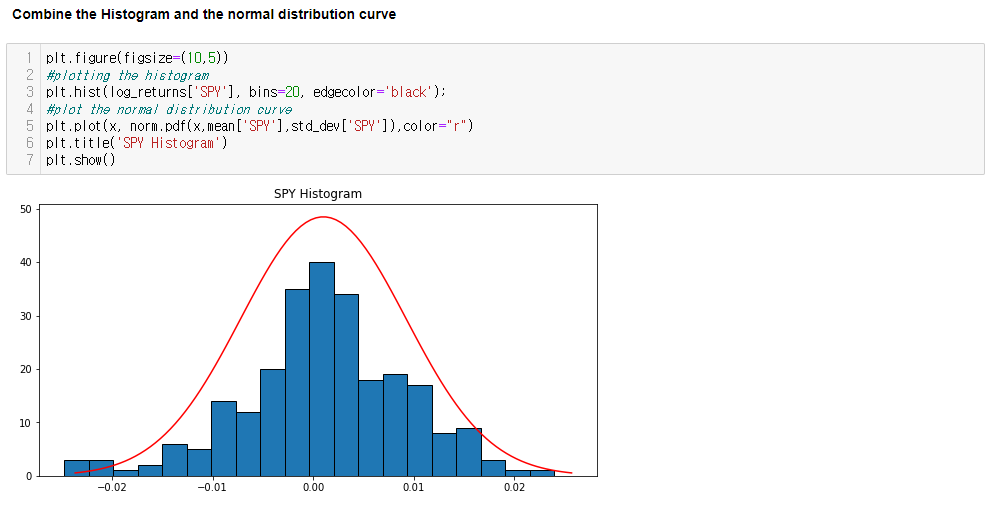
Daily returns of most financial instruments

- Central peaks are higher
- Tails are longer
- Balance of tail distribution is uneven
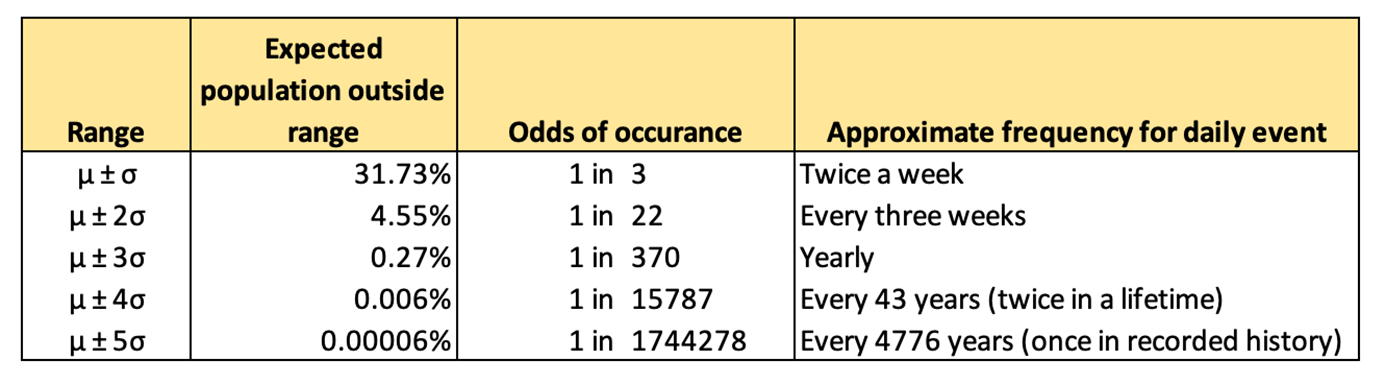
+ 정규분포 특징- Mean = Median
- Equal number of measurements above and below the mean value
- Mean ± 3 SD contains 99.7% of all values
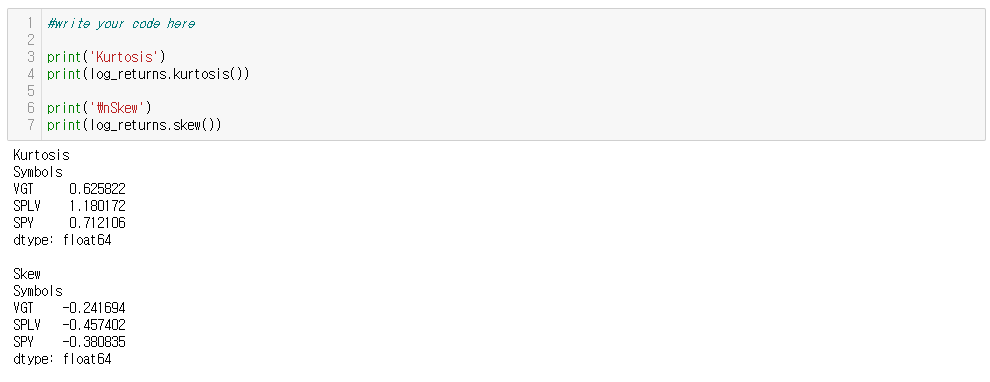
Quantifying variation of distributions
# Skew (왜도)
- Measures whether the distribution skewed to one side or the other

# Excess kurtosis (첨도)
- Measures the relative height of the peak and thickness of the tails
---

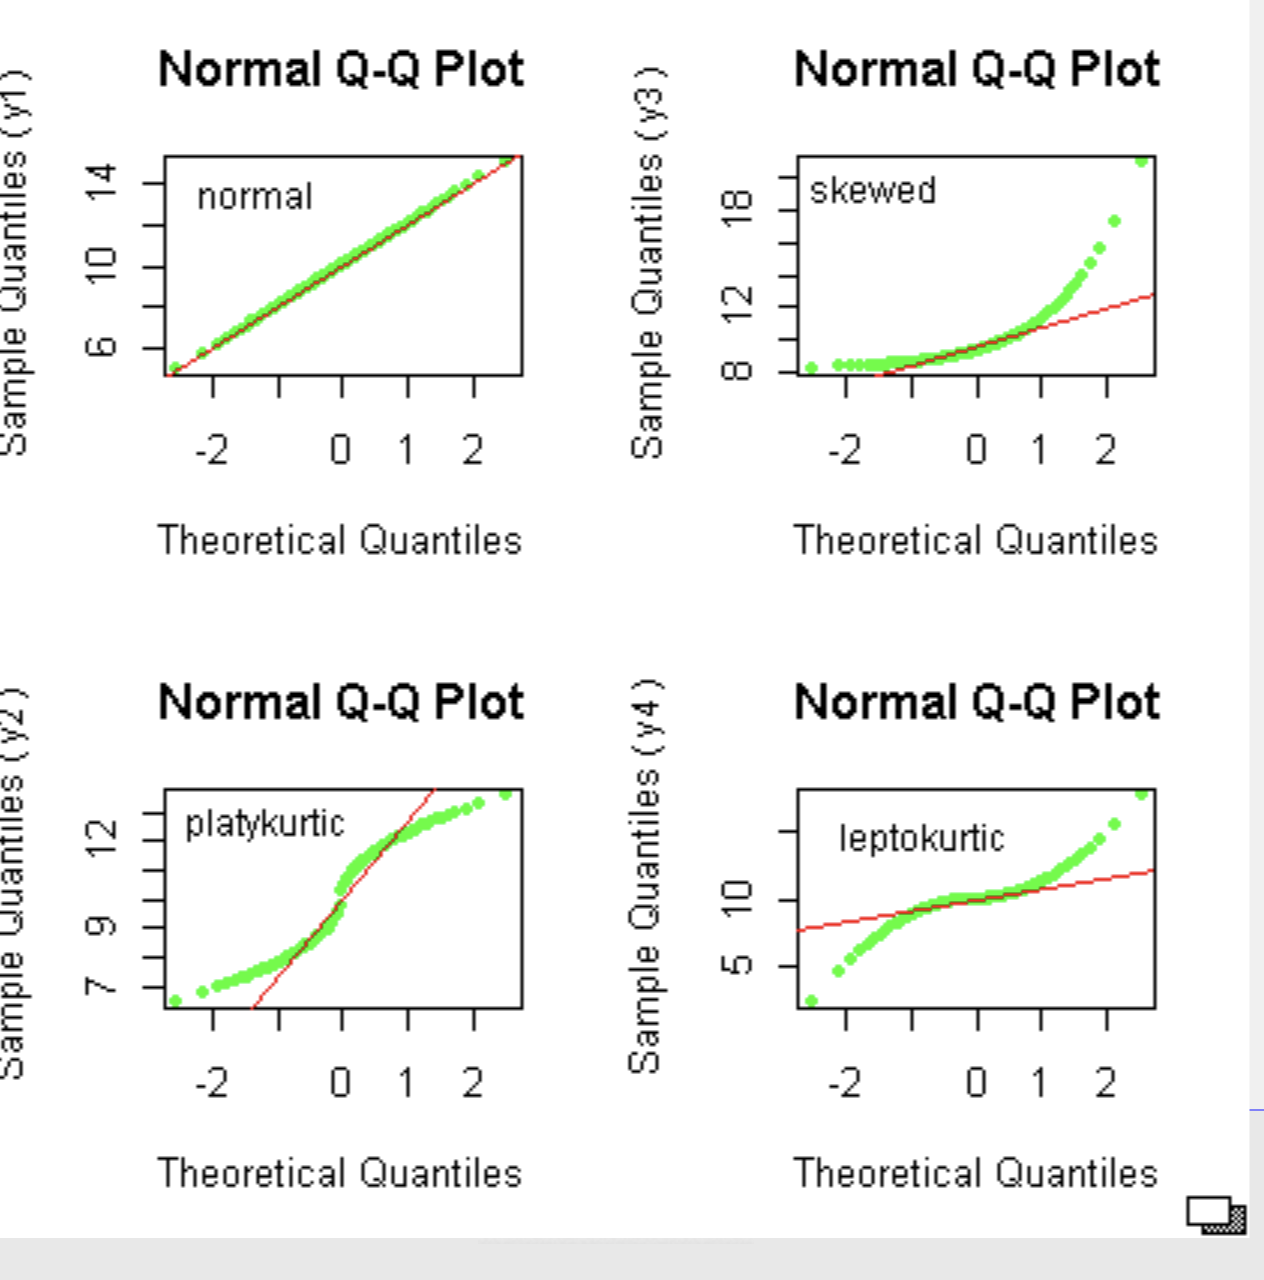
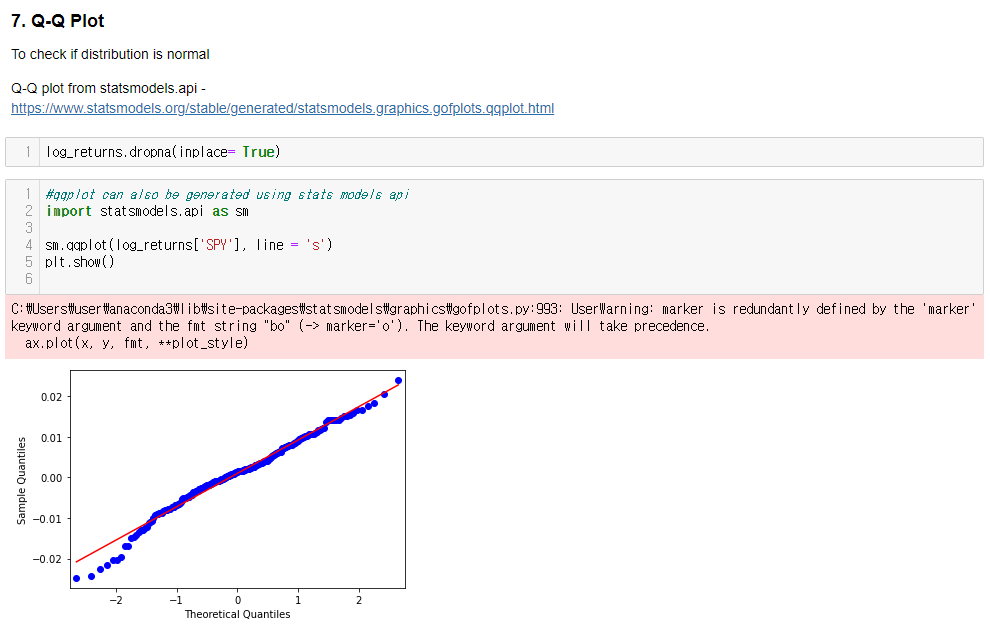
Normal Quantile-Quantile Plots
- Provides a visual check if a dataset is normally distributed (데이터가 정규분포를 따르는지 시각적으로 확인하는 방법)
- Scatterplot of the quantiles of the data versus the quantiles of a normal distribution
Real-world Business Impact
- Extreme losses may be under-observed if the sample size is not large enough
- Potential losses underestimated ("fat-tail risk")
+ Fat tail risk (= tail risk) : 거대한 일회성 사건이 자산 가치에 큰 영향을 주는 리스크. 정규분포 곡선에 따르면 바깥으로 갈수록 높이가 낮아지는 꼬리모양을 이루는데, 경우에 따라 발생확률이 적은 현상이 나타나면서 정규분포가 예측하는 것보다 빈도가 커져 꼬리가 굵어지는 위험을 뜻함.